CGR Labs Day 4: LLM optimization, kind of
 Ciprian · · 7 min read
 I’ve been trying to self-host some AI models on my Hetzner server, and it’s been an experience. My first idea was to run big models like gpt-oss-120b or Kimi-Dev-72B, which didn’t go so well.
After a lot of debugging, I finally got a 72B model to give me a response: 0.8 tokens per second. The funny thing is, the server wasn’t even trying hard. CPU was low, memory was fine. It was just incredibly slow.
And just to clarify, trying to figure out a way to run inference for production apps, not just as a coding agent for local development or to experiment with open source models. There is a slice of my cluster reserved for that purpose, but right now I wanted to figure out if I can run a local model in production and not have to use LLM providers.
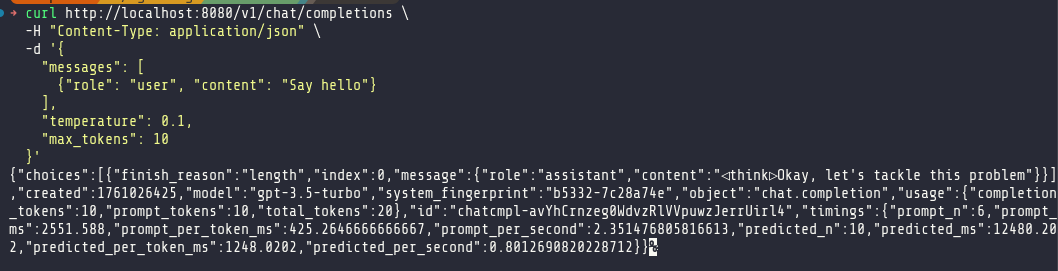
Clearly, anything over 30B was off the table. I pivoted, deciding to find a smaller, specialized model. My first attempt was with mradermacher/stackexchange_fitness-GGUF, a Q8 model. This gave me a more reasonable, but still underwhelming, 6 tokens per second—far below the 10 t/s I’d seen with a the Qwen3-30B at the Q4 quantization.
This became my new baseline. It was time to start optimizing.
Round 1: Kubernetes and Llama.cpp Tuning
The first order of business was fixing the deployment itself. My rolling restarts were painfully slow, taking several minutes for a new pod to become ready. This lag was caused by overly generous initialDelaySeconds on my readiness and liveness probes, which were delaying the rollout process unnecessarily.
I dove into the Kubernetes configuration, making several changes to tighten things up and apply some immediate performance flags to llama.cpp.
Here’s a summary of the key adjustments:
- Faster Rollouts: I replaced the long initial delays with a proper
startupProbe. This probe has a long timeout, giving the model plenty of time to load, but once it passes, the fasterreadinessProbeandlivenessProbetake over. This change, combined with a shorterterminationGracePeriodSeconds, brought my rollout time down to under two minutes. - Guaranteed QoS: I set memory requests equal to limits (
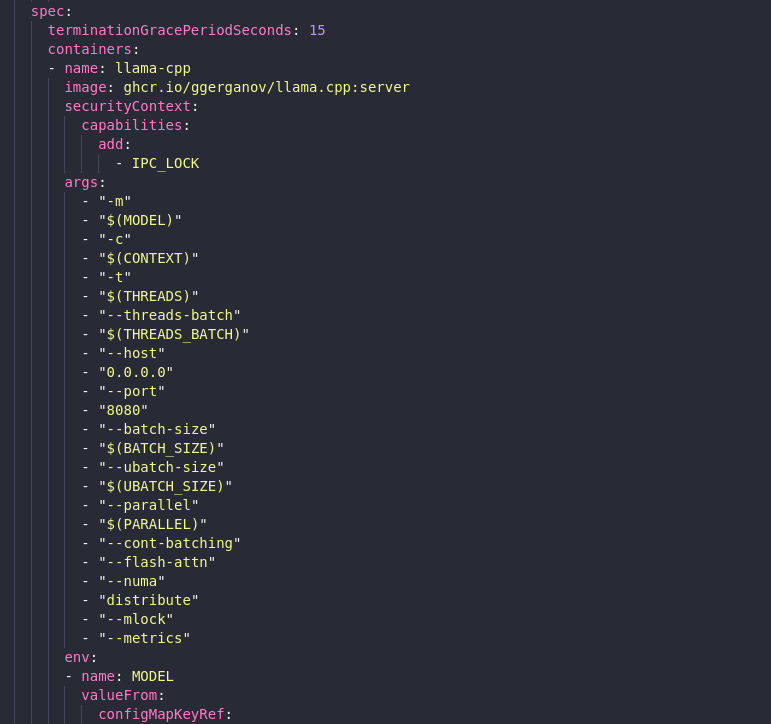
128Gi). This puts the pod in theGuaranteedQoS class, preventing it from being throttled and ensuring it gets the resources it asks for. - Llama.cpp Throughput Flags: I enabled a suite of performance-oriented flags:
--cont-batchingfor continuous batching,--flash-attnfor memory-efficient attention,--numa distributeto spread across NUMA nodes, and--mlockto keep the model in RAM. This required adding theIPC_LOCKcapability to the pod’s security context. - Batching and Threading: In the
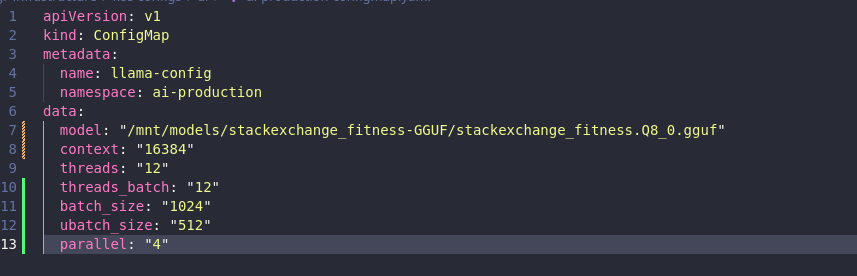
ConfigMap, I increased the thread count to 12 and configured batch sizes to better utilize the CPU for prompt processing.
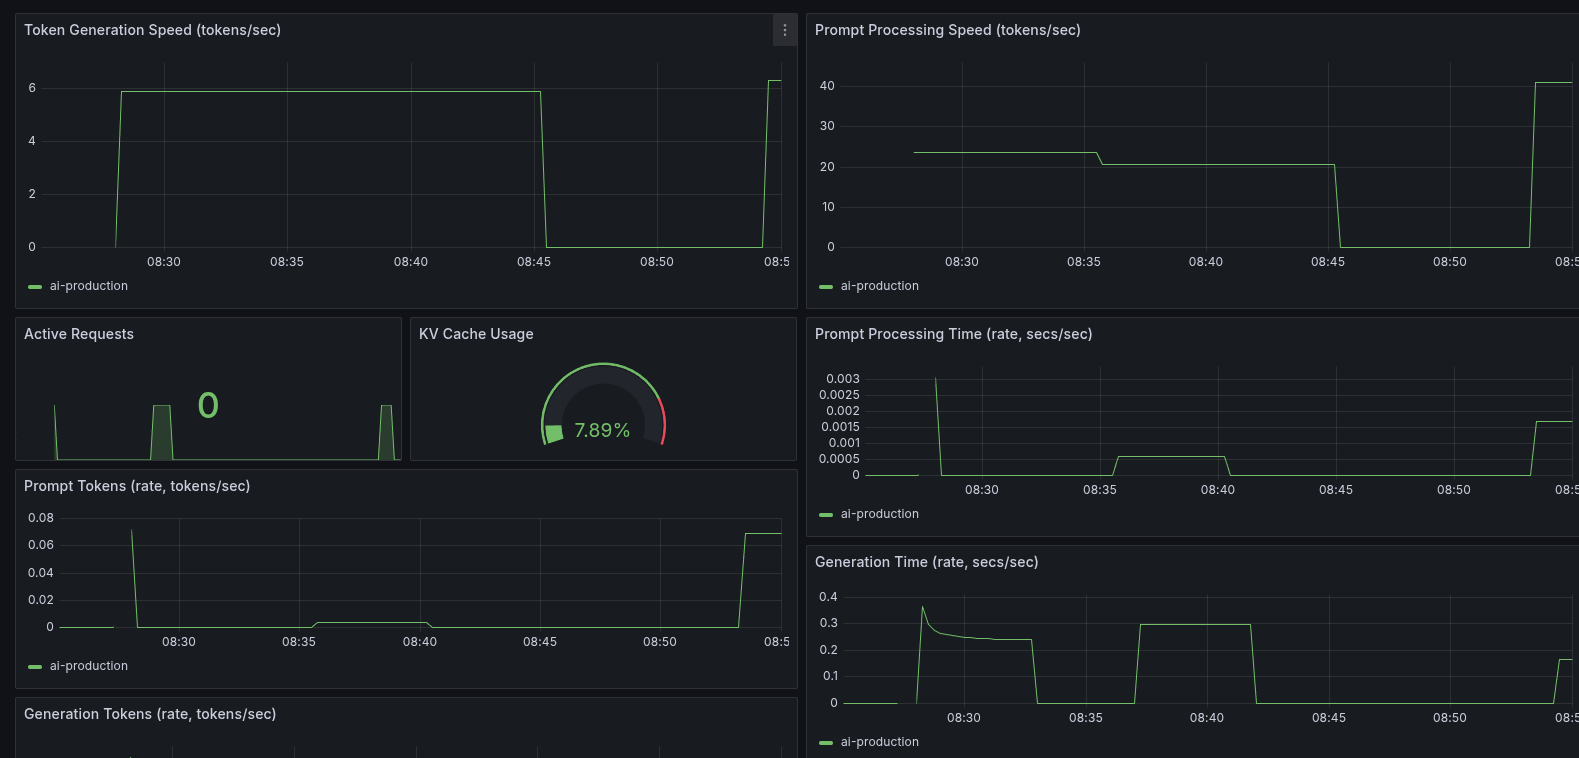
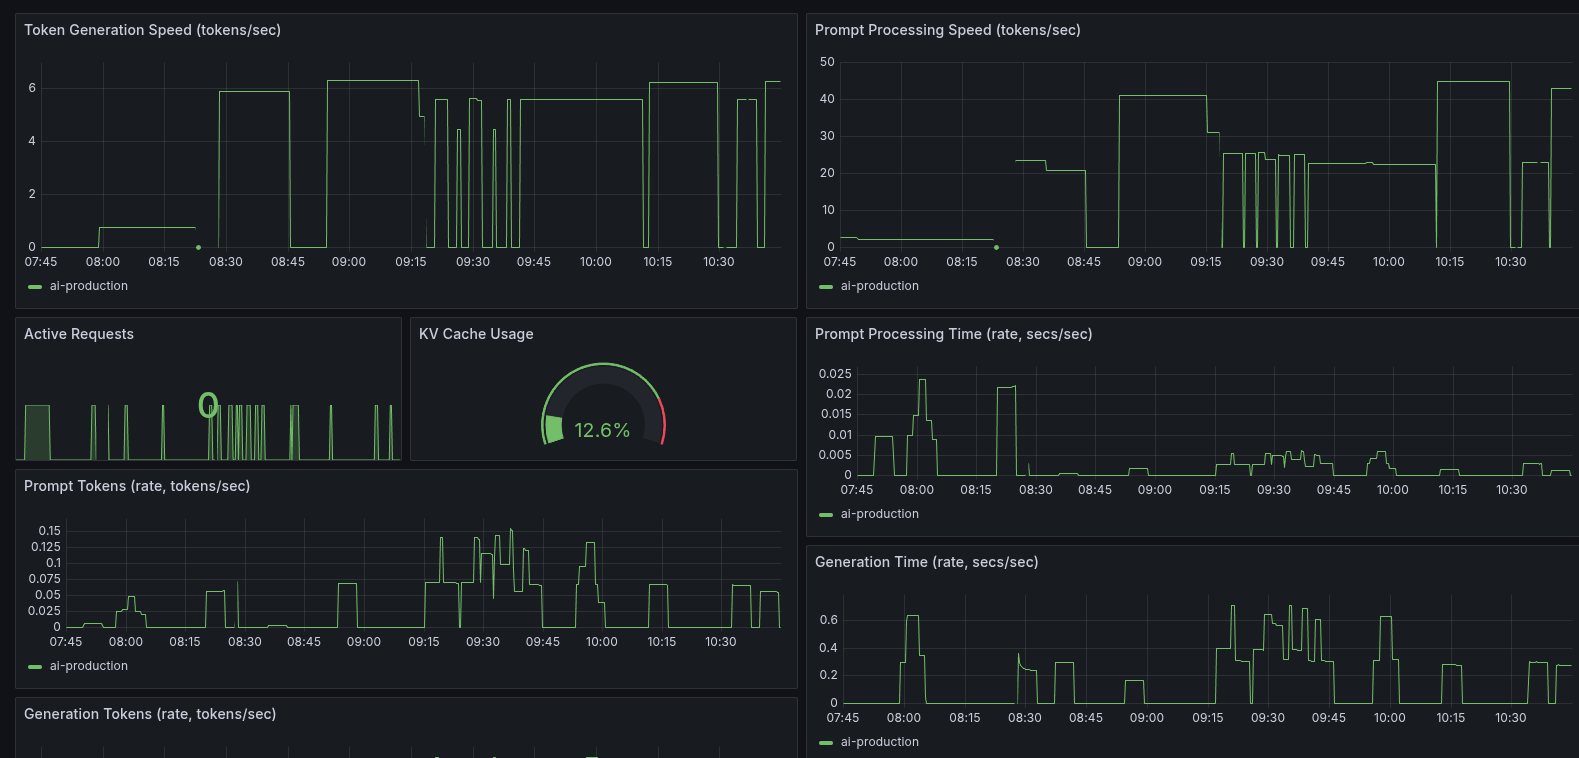
After applying these changes, the results were interesting. The raw token generation speed didn’t increase much, but the prompt processing speed nearly doubled. This was a significant win for handling initial prompts and batch requests. The modest token speed was also understandable, given I was now using a higher-quality Q8 model compared to the previous Q4.
Round 2: The CPU Pinning Experiment
With the low-hanging fruit picked, I ventured into more advanced territory: CPU and NUMA topology management. The goal was to enable Kubelet’s static CPU Manager policy to give my llama.cpp pod exclusive access to whole physical cores on a single NUMA node. In theory, this should reduce context switching and improve memory access patterns.
Getting this to work in k3s was tricky. It required adding specific kubelet-arg flags to the k3s config and a careful restart sequence to avoid sending the node into a crash loop.
After much trial and error, I successfully enabled the static policy. I verified from inside the pod that it was indeed pinned to a specific set of CPUs. I was ready to see the performance gains.
And then… it regressed.
My token generation speed dropped. The very optimization that was supposed to provide a boost had made things worse. Re-enabling the --numa distribute flag clawed back some of the loss, but it never surpassed the performance of the unpinned configuration.
Why the regression? LLM decoding is heavily memory-bandwidth bound. On a multi-socket EPYC CPU, the Linux scheduler does a surprisingly good job of balancing the workload across all available memory channels. By pinning the process to a single NUMA node, I had inadvertently created a bottleneck, constraining a workload that actually benefited from the scheduler’s freedom.
I rolled back the CPU pinning changes but kept the Guaranteed QoS and the llama.cpp runtime tuning. This experience was a humbling reminder that in complex systems, well-intentioned optimizations can have counterintuitive effects. Sometimes, the defaults are there for a good reason.
Round 3: Fine-Tuning Performance Parameters
With the broader infrastructure tuning sorted, I moved on to fine-tuning the model’s runtime parameters. This involved a series of experiments around quantization, threading, and batching to squeeze out more performance.
The Impact of Quantization
I switched from the initial Q8 model to a Q4 quantized model, hoping for a significant performance increase. It did help, but very little. With the Q4 model, I got 6.85 tokens per second versus the 6.50 t/s from before, though my prompt processing speed decreased slightly from 42 t/s to 40 t/s.
The Effect of Batching
At this point, things were getting rather annoying. I disabled most of the batching customizations like batch_size, ubatch_size, and threads_batch—lo and behold, I now had 7.6 t/s. That, however, decreased my prompt processing speed to 47 t/s, highlighting the trade-offs between raw generation speed and prompt handling.
The Threading Sweet Spot
Next, I decided to try some things related to the number of threads assigned. At least this part was straightforward and predictable. With every thread I added to the deployment, I would gain about 0.6 t/s. There seemed to be a point of diminishing returns, however, since adding 48 threads barely increased token generation by 1.5 t/s. More annoyingly, I couldn’t do rollout restarts anymore because I didn’t have 96 threads available.
After some experimentation, I found that my sweet spot is at 22 threads. Token generation speed doesn’t increase much more from there, but I did lose quite a bit of prompt processing speed when decreasing the number of threads.
Validating Core Flags
I was also curious to see if the other optimization settings I enabled in Round 1, like flash attention and NUMA distribution, actually did anything. After getting a dismal 3.2 t/s with them disabled, I can confidently say that yes, they do work.
Round 4: The Model Matters Most
After all this messing around with optimization, the thing is, when I started the process I was getting 11 t/s with my Qwen3-30B model at the same Q4 quantization I was now using. So I decided to move back to Qwen and see if there’s any real improvement.
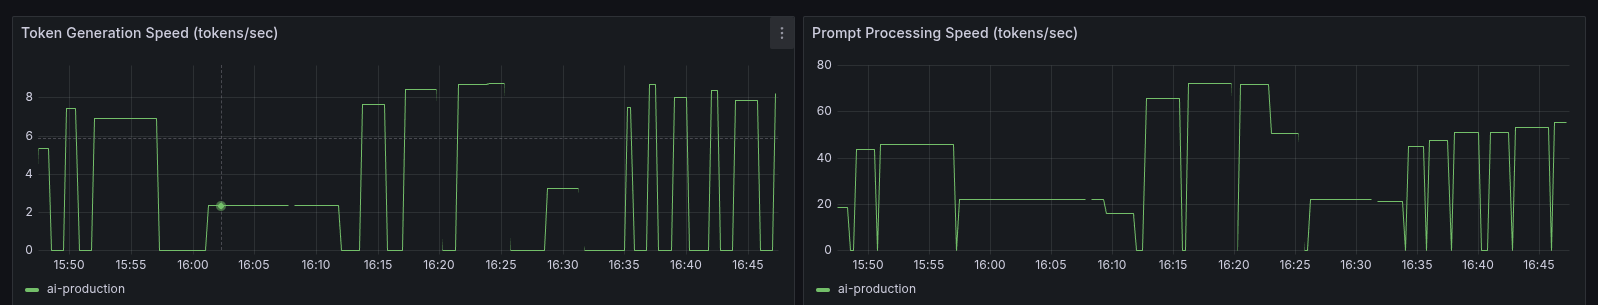
And there was. The better architecture of Qwen3 gave me 14.28 t/s with the increased number of threads and optimized configuration.
Conclusion
This journey was a lesson in priorities. While Kubernetes tuning and parameter tweaking are valuable, the choice of model architecture proved to be the most critical factor for performance. I also learned that I definitely can’t do a better job at tuning than Linux and llama.cpp already did, but I suppose that should have been predictable.
Next step is to fine-tune and train a Qwen model for fitness expertise.