CGR Labs Day 3: Observability
 Ciprian · · 6 min read
 I’m building a system to experiment with local LLM models and host my apps. I’m using a dedicated Hetzner server with a Kubernetes cluster on it. I’ve always wanted to run Kubernetes on bare metal and escape the managed K8s golden handcuffs. We’re also running AI inference on CPU (slow as it is), so squeezing efficiency matters.
Yesterday I got the production-ai service running with llama.cpp and Qwen3-30B at ~12 tokens/second. Today’s goal: establish comprehensive observability so I can see exactly how well the models are utilizing the resources and if my performance tuning will actually do anything.
What we’re building
┌─────────────────────────────────────────────────────────────────┐
│                      K3s CLUSTER                                │
│                                                                 │
│  ┌──────────────┐  ┌──────────────┐  ┌──────────────┐           │
│  │   Web Apps   │  │  AI Models   │  │   Database   │           │
│  │              │  │  (llama.cpp) │  │  (Postgres)  │           │
│  └──────┬───────┘  └──────┬───────┘  └──────┬───────┘           │
│         │                 │                  │                  │
│         │ /metrics        │ /metrics         │ /metrics         │
│         │                 │                  │                  │
│         └─────────────────┼──────────────────┘                  │
│                           │                                     │
│  ┌────────────────────────▼────────────────────────────┐        │
│  │              PROMETHEUS                             │        │
│  │         (Metrics Collection & Storage)              │        │
│  │                                                     │        │
│  │  • Scrapes /metrics endpoints every 15-30s          │        │
│  │  • Time-series database                             │        │
│  │  • 15-day retention                                 │        │
│  └────────────────────┬────────────────────────────────┘        │
│                       │                                         │
│                       │ PromQL Queries                          │
│                       │                                         │
│  ┌────────────────────▼────────────────────────────┐            │
│  │              GRAFANA                            │            │
│  │         (Visualization & Dashboards)            │            │
│  │                                                 │            │
│  │  Cluster Overview                               │            │
│  │  Hardware Metrics                               │            │
│  │  AI Performance                                 │            │
│  │  Application Health                             │            │
│  └─────────────────────────────────────────────────┘            │
│                                                                 │
│  ┌──────────────────────────────────────────────────────────┐   │
│  │         METRIC EXPORTERS                                 │   │
│  ├──────────────────────────────────────────────────────────┤   │
│  │  • node-exporter: Hardware metrics (CPU, RAM, disk)      │   │
│  │  • kube-state-metrics: Kubernetes object state           │   │
│  │  • Application metrics: Custom app instrumentation       │   │
│  └──────────────────────────────────────────────────────────┘   │
│                                                                 │
└─────────────────────────────────────────────────────────────────┘
Observability Flow
Application/Service
       ↓
   /metrics endpoint (Prometheus format)
       ↓
   Prometheus (scrapes & stores)
       ↓
   Grafana (queries & visualizes)
       ↓
   Dashboard (actionable insights)
Key Metrics Tracked
Infrastructure
- CPU usage per core
- Memory utilization
- Disk I/O and space
- Network throughput
Kubernetes
- Pod health and restarts
- Resource requests vs limits
- Deployment status
AI Models
- Tokens per second
- Request latency (p50, p95, p99)
- Queue depth
- Inference errors
Applications
- Request rates
- Response times
- Error rates
- Database connections
Technology Stack
- Prometheus: Metrics collection and time-series storage
- Grafana: Visualization and alerting
- node-exporter: Hardware-level metrics
- kube-state-metrics: Kubernetes cluster state
- llama.cpp: Built-in Prometheus metrics for LLM inference
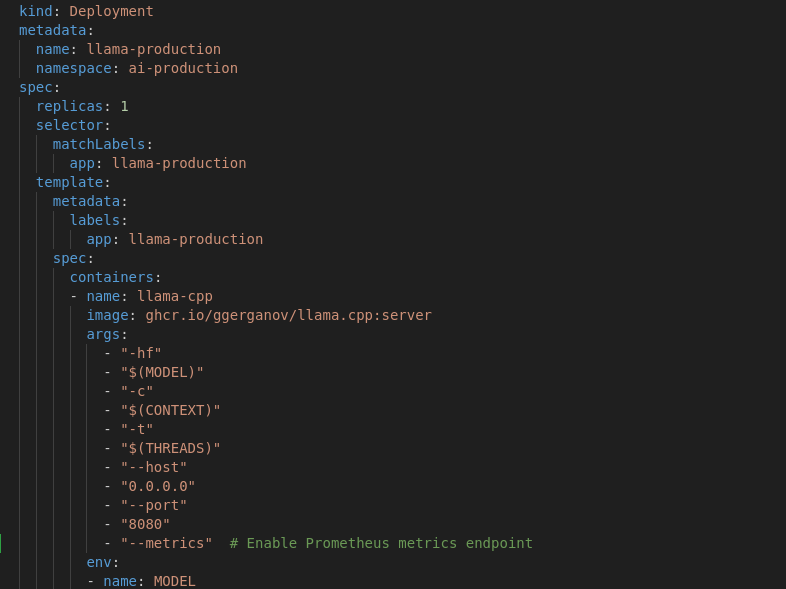
llama.cpp monitoring
llama.cpp already exposes a metrics endpoint, so all I had to do was enable it in my deployment.
Set up monitoring
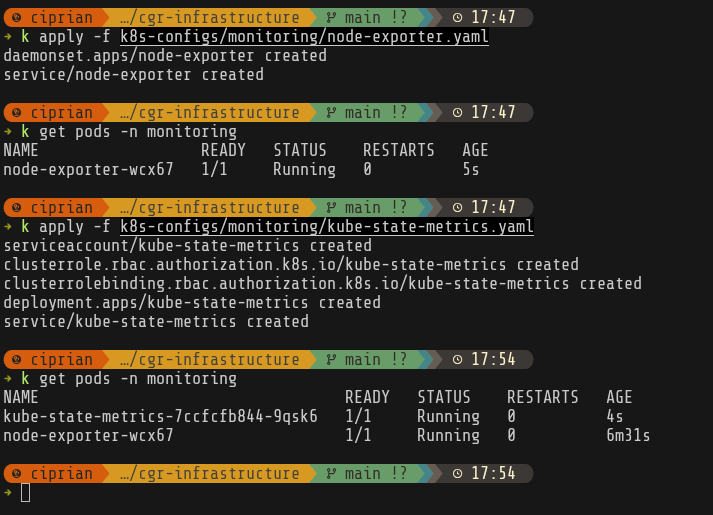
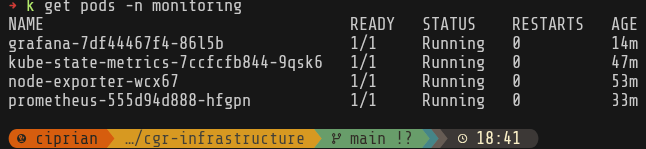
I’ll start by setting up node-exporter and kube-state-metrics. node-exporter runs on every node and exposes detailed hardware-level metrics—CPU usage per core, memory statistics, disk I/O, network throughput, and even temperature sensors. kube-state-metrics provides insight into the cluster’s logical state by exposing metrics about Kubernetes objects themselves: pod phases, deployment replica counts, resource requests and limits, and restart counts.
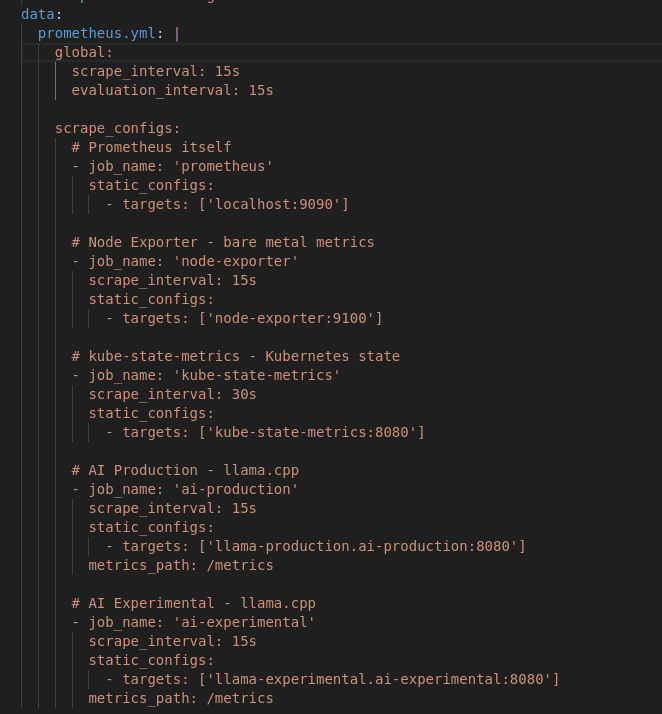
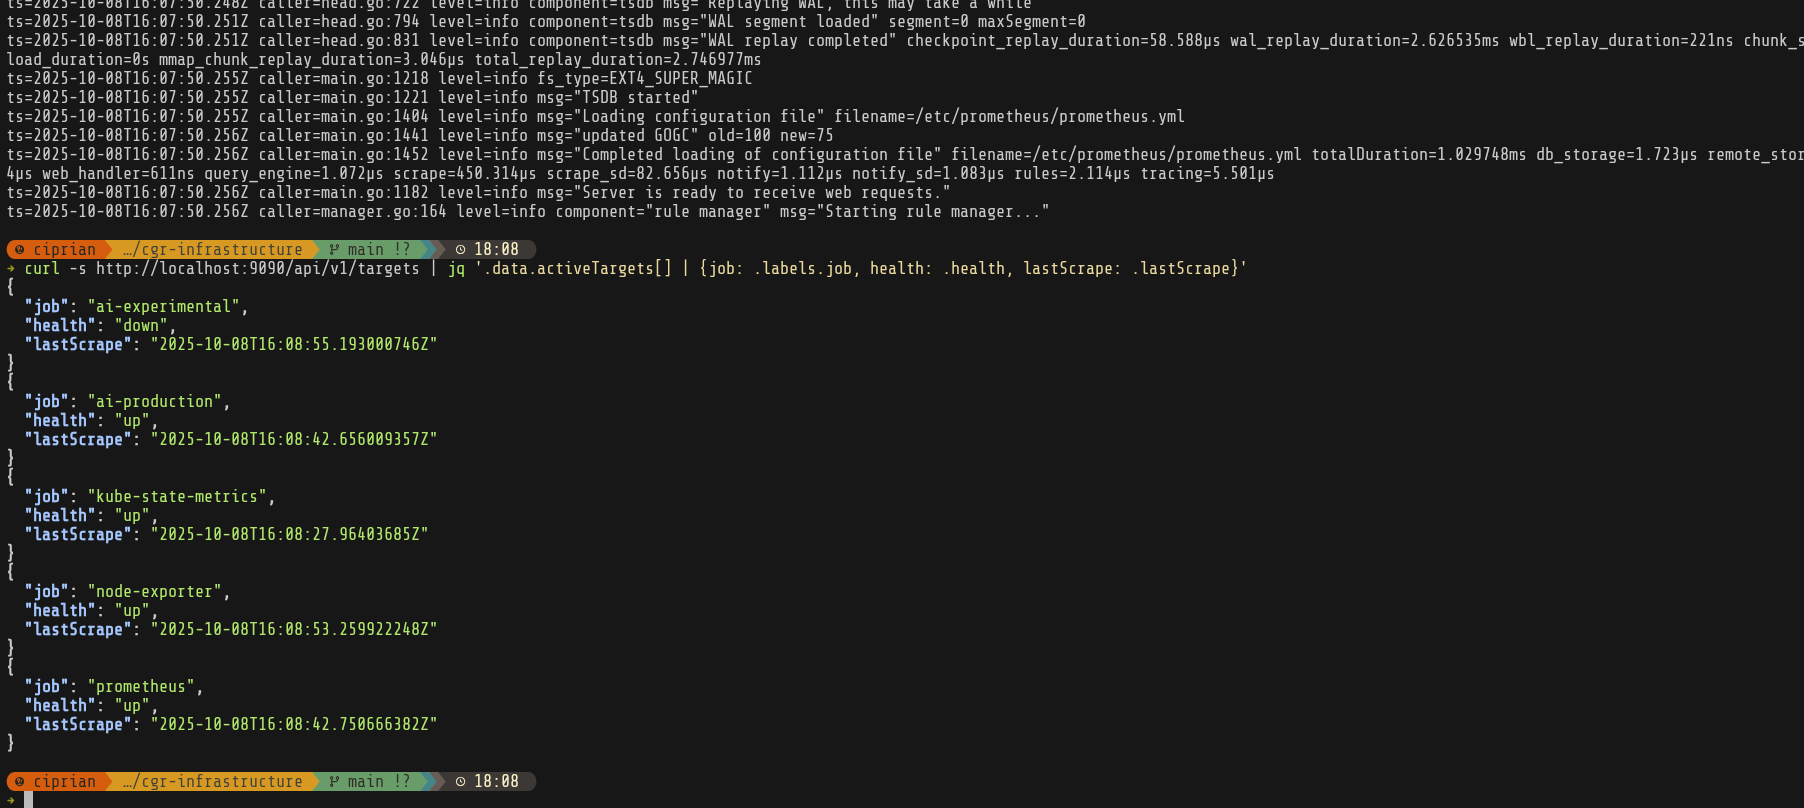
After that I set up the prometheus persistent volume and prometheus itself configured to scrape metrics from all our exporters.
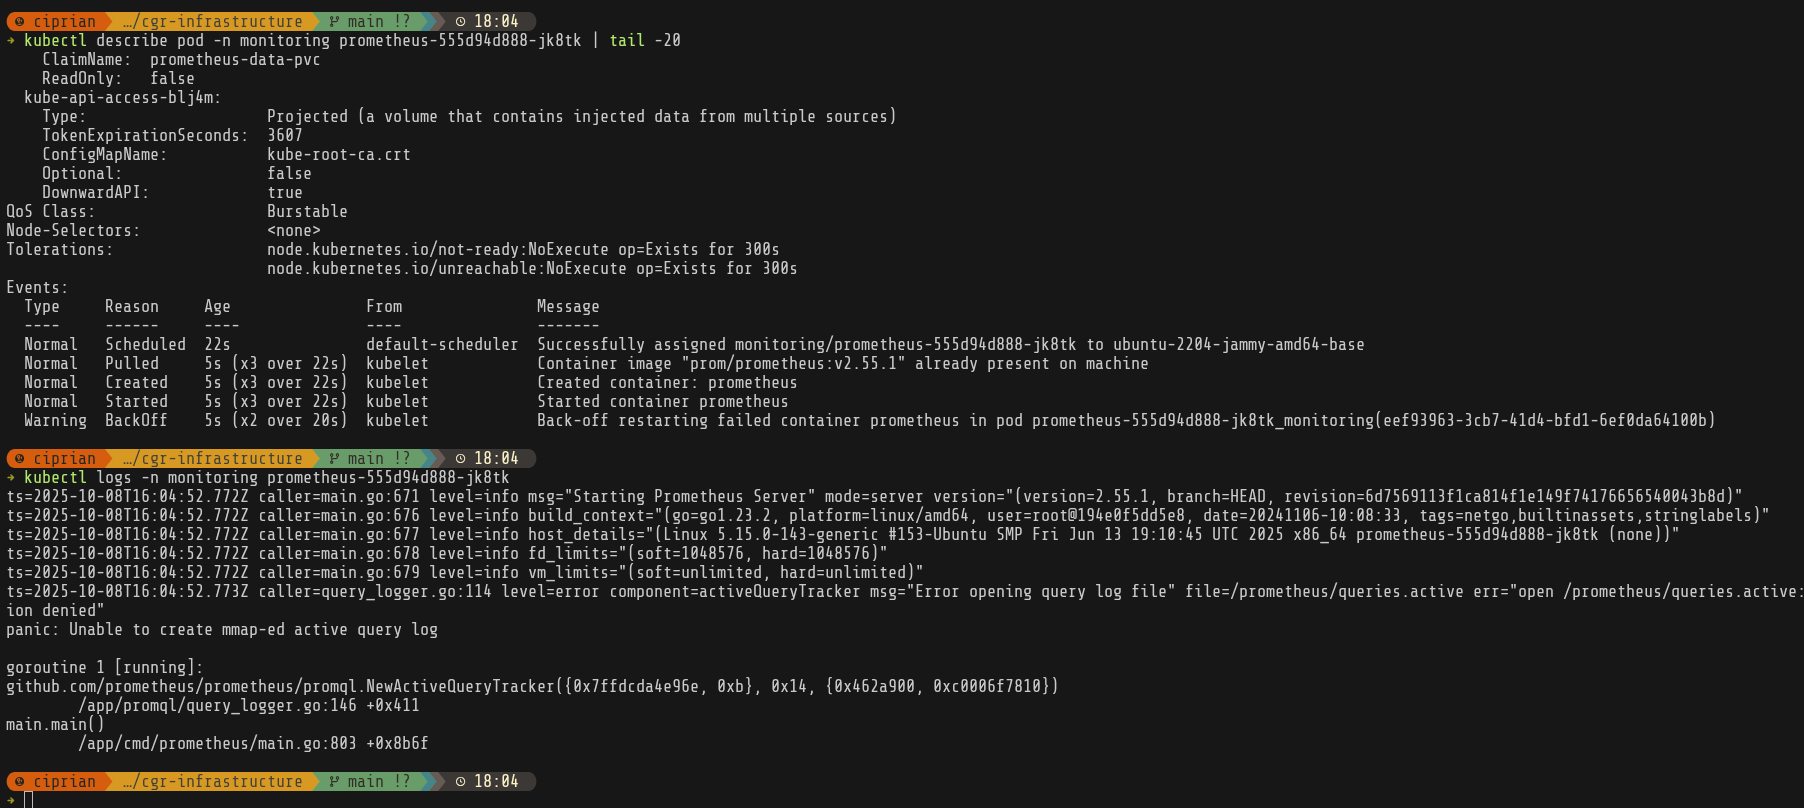
It was at this point that I realized I forgot to actually create the /mnt/monitoring folders and give the right permissions on it, so prometheus was crashlooping.
Finally everything is running and our scrapers are up—except for ai-experimental, which hasn’t been created yet. Next up: Grafana.
Setting up Grafana
After I added the persistent volume (create folders, set up permissions) and got the service running—after dealing with a bunch of Let’s Encrypt + Cloudflare + Vodafone quirks—I still wasn’t seeing Grafana in the browser. The pod was healthy, the certificate had been issued, so I just needed to wait for Vodafone DNS propagation.
I have to remember to set up DNS records before I start and also to disable proxied traffic to services until I get the https certificate issued.
While I wait for that, I’ll set up some dashboards.
Grafana dashboards
First, let’s see what metrics we’re getting from llama.cpp.
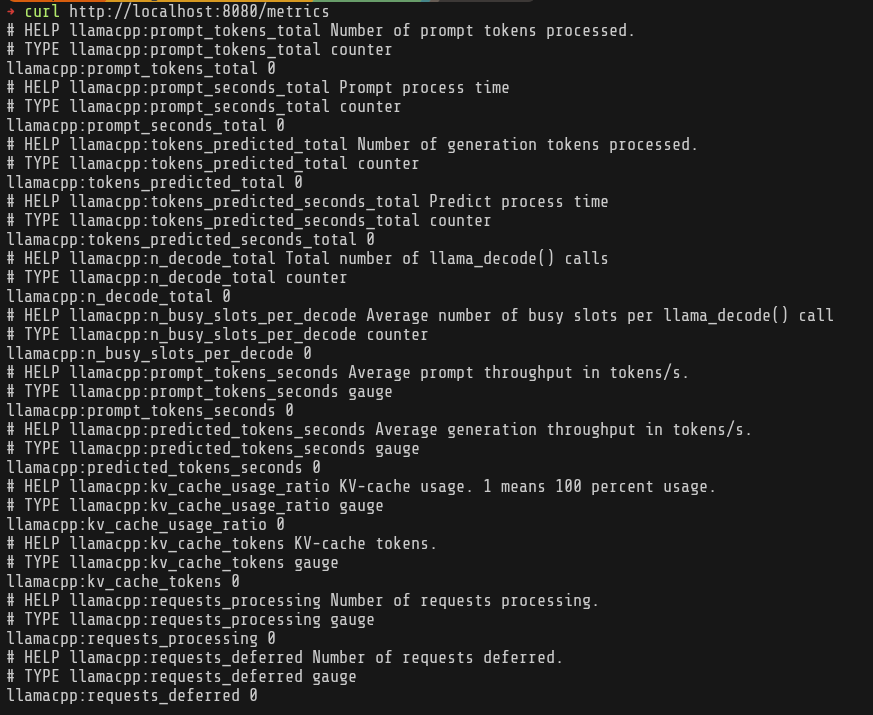
Ok, based on llama.cpp metrics and node-exporter, we basically want to track combined metrics to see LLM inference performance and cluster utilization.
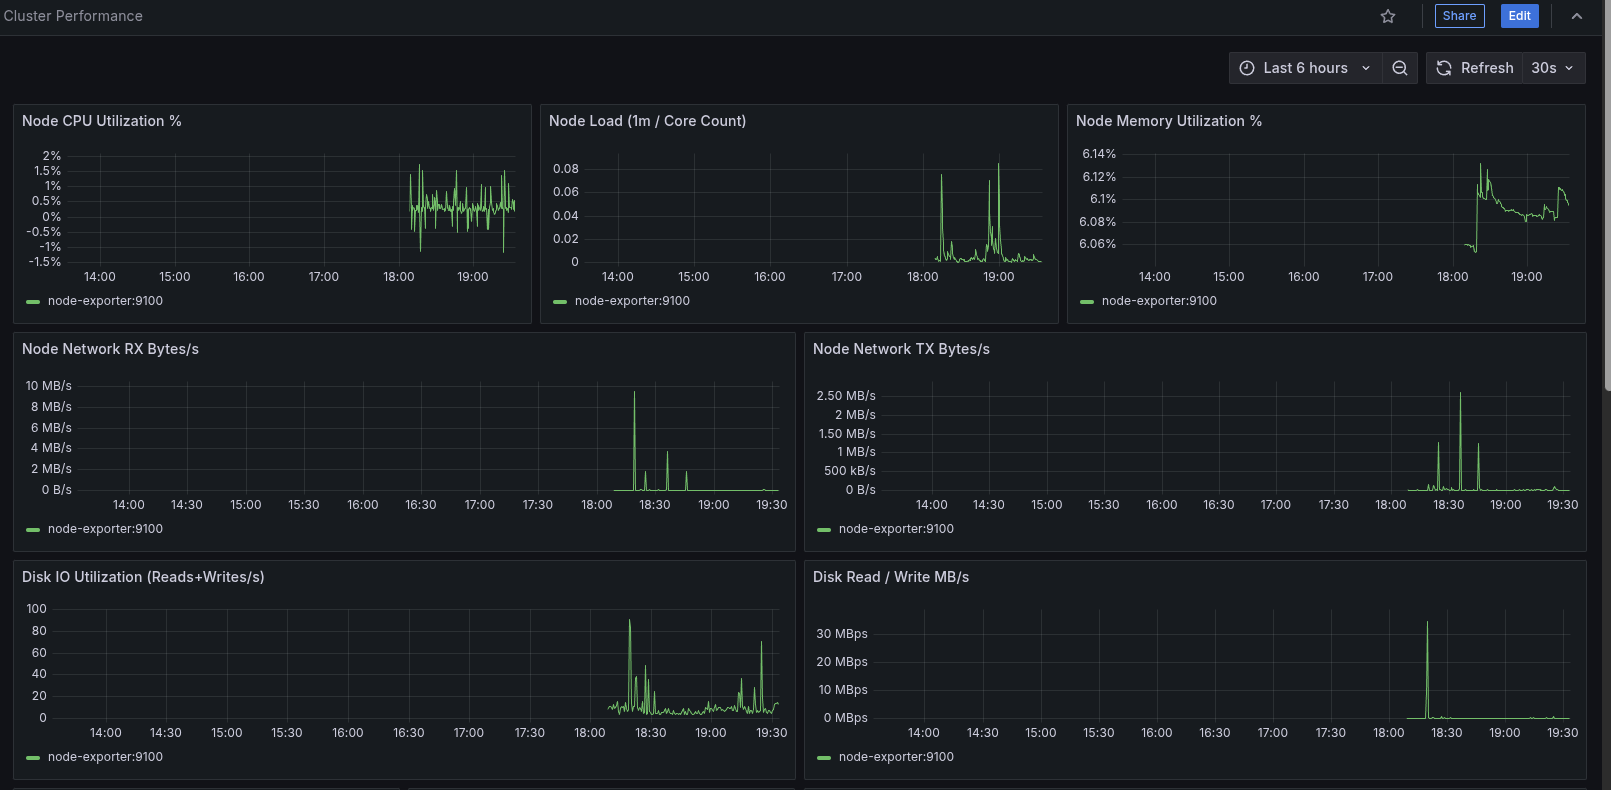
cluster-performance dashboard
Focus: overall node + namespace health & pressure signals.
- Node CPU, load (normalized per core), memory %, network RX/TX, disk I/O (ops & throughput)
- Namespace CPU & memory, pod throttling ratio, pod phase distribution, pod counts
- PSI (Pressure Stall Information) panels for CPU / memory / IO
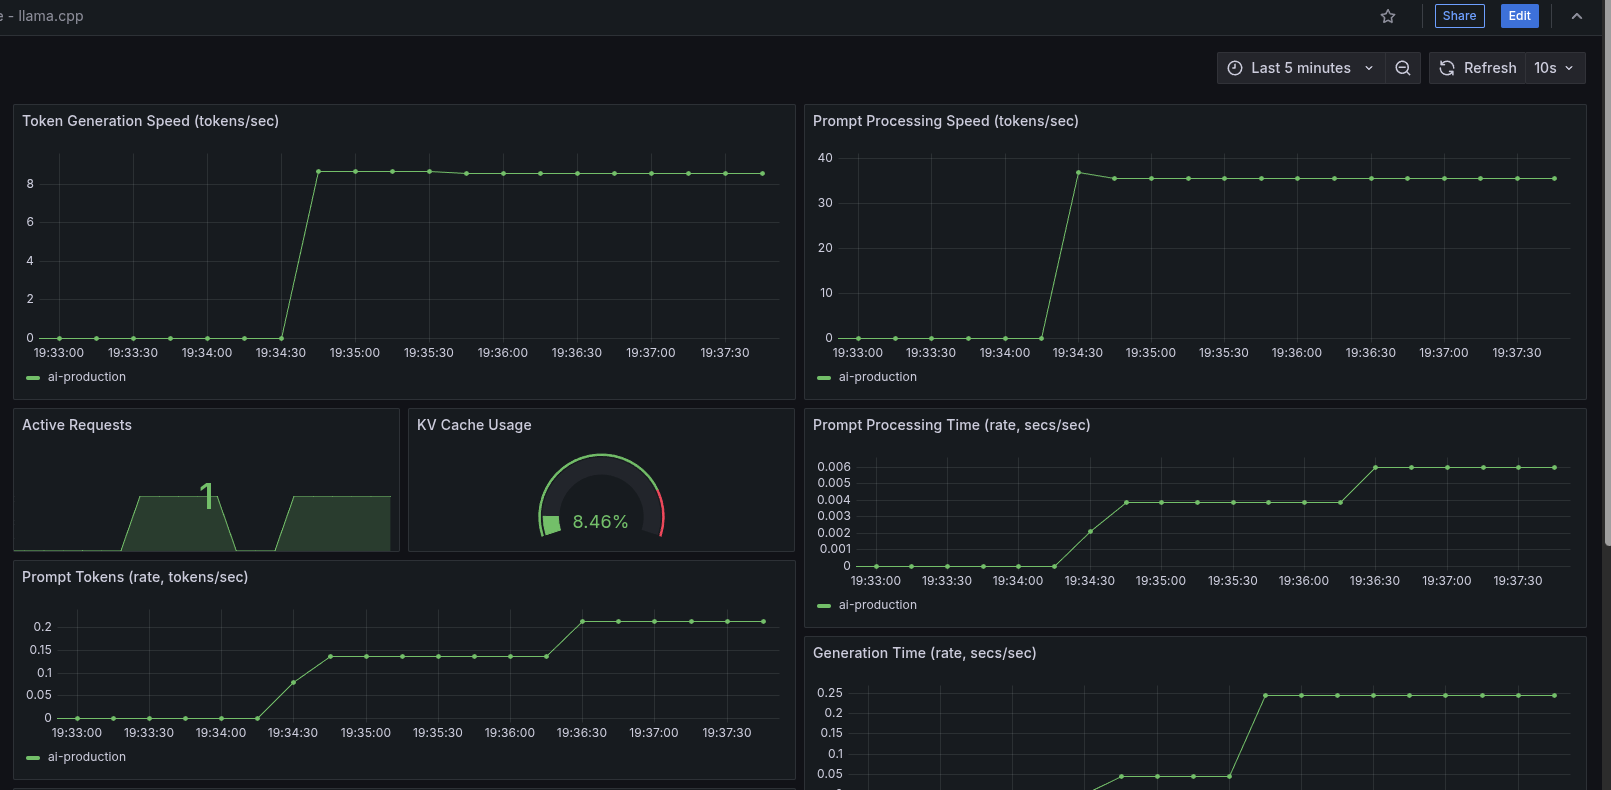
llama.cpp dashboard
Focus: model serving performance & utilization.
- Token & prompt throughput
- Active requests & queue depth
- KV cache utilization / fragmentation signals
llm-tuning dashboard
Focus: correlating inference throughput to resource usage.
- Correlates llama.cpp tokens/sec with node & pod CPU usage
- Prompt vs generation time split; active vs deferred requests
- KV cache utilization patterns & decode slot occupancy
- Memory & CPU throttling for llama pods; efficiency (tokens per CPU second)
- Prompt/gen time ratio trend
I also added some Prometheus recording rules since some of the panels got a bit too complex.
After creating the dashboards JSON files, I set them up as ConfigMaps (questionable—could switch to sidecar or S3/gitrepo provisioning later):
kubectl create configmap grafana-dashboards \
  --from-file=k8s-configs/monitoring/dashboards/ \
  -n monitoring \
  --dry-run=client -o yaml > k8s-configs/monitoring/grafana-dashboards.yaml
Also set up the dashboard provider and added the volumes to the Grafana deployment.
Meanwhile DNS is also fixed so we can actually see our dashboards.
That’s it for today. With the monitoring stack in place, next steps:
- Performance tuning (
numactl, CPU pinning, memory bandwidth awareness). - Experiment with more CPU-friendly model variants.
- Fix some of the panels that don’t yet have data because I’m not exporting the metrics or the calculations are invalid.
I’ll cover tuning, scheduling, and model selection in the next post.